Core earnings (as featured on CNBC Squawk Box) measures the normalized operating profitability of a business. Accordingly, when calculating core earnings, analysts should strip out any gains/losses that are non-core, non-operating, or unusual.
The Problem
Identifying unusual items has become increasingly difficult. Companies hide this information in the footnotes in ever more sophisticated ways. It’s gotten so difficult to unravel, that most analysts and data providers are just not doing it. As a result, markets inefficiently measure core earnings – as professors from Harvard Business School (HBS) & MIT Sloan show in “Core Earnings: New Data & Evidence.”
The Answer
The paper shows that our “novel dataset of footnotes adjustments” provides a measure of core earnings that is “incremental to alternative measures of operating performance in predicting an array of future income measures.” The alternative measures used in the paper are “Street Earnings” from Refinitiv’s IBES, owned by Blackstone (BX) and Thomson Reuters (TRI), and “Income Before Special Items” from Compustat, owned by S&P Global (SPGI). See section 3.4 of the paper for more details.
The professors empirically conclude that our adjusted core earnings are meaningfully superior to those from Compustat and IBES, and increasingly so over time.
Figure 1 shows how we calculate core earnings.
Figure 1: How to Calculate Core Earnings
Total Revenue
+ Total Operating Income
– Reported Non-Operating Expense, Net
+ Total Hidden Non-Operating Expense, Net
– Reported Interest Expense/(Income), Net
– Reported Losses/(Income) from Unconsolidated Subsidiaries, Net
+ Goodwill Amortization Expense, Net
– Unreported Employee Stock Option (ESO) Expense
– Cash Taxes on Core Earnings
– Reported Minority Interest Expense, Net
– Reported Preferred Dividends, Net
– Reported Dividends on Redeemable Preferred Stock, Net
= Core Earnings
Sources: New Constructs, LLC and company filings
For a more details on our calculation of core earnings, including details on the hidden and reported items we collect, click here. For details on the difference between the “Reported” and “Hidden” items, click here.
Earnings Distortion = Net Income Minus Core Earnings
Earnings distortion is the non-core, non-operating, and unusual gains/losses that must be stripped out when calculating core earnings. It equals reported earnings minus core earnings. Figure 2 shows the key components of core earnings distortion. The higher the earnings distortion, the more overstated reported earnings are. The lower the earnings distortion, the more understated reported earnings are.
Figure 2: Components of Earnings Distortion
+ Earnings Distortion from 13 Categories of Hidden Items, Net
+ Earnings Distortion from 13 Categories of Reported Items Pre-Tax, Net
+ Income Tax Distortion
+ Earnings Distortion from 2 Categories of Reported Items After-Tax, Net
= Total Core Earnings Distortion, Net
Sources: New Constructs, LLC and company filings
Figure 3 shows the “Hidden” items we display on the Core Earnings pages in our company valuation models on over 5,000 stocks.
Figure 3: “Hidden” Items Details from our Models
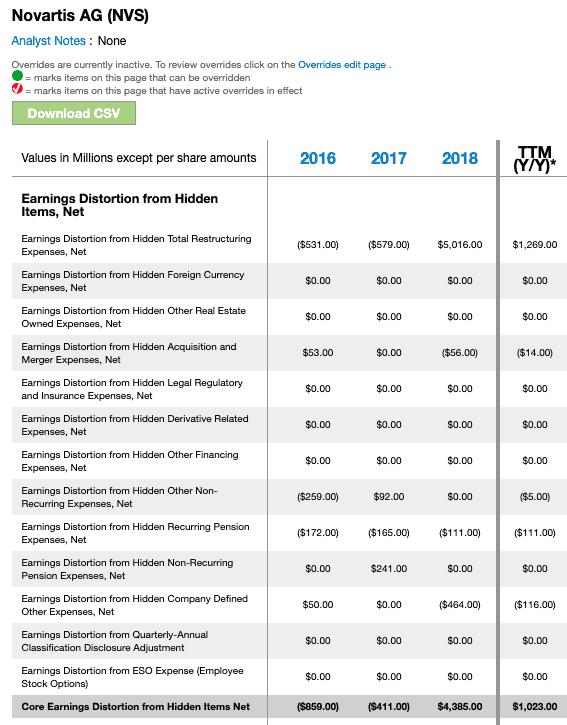
Sources: New Constructs, LLC and company filings
Figure 4 shows the “Reported” items we display on the Core Earnings pages in our company valuation models on over 5,000 stocks.
Figure 4: “Reported” Items Details from our Models
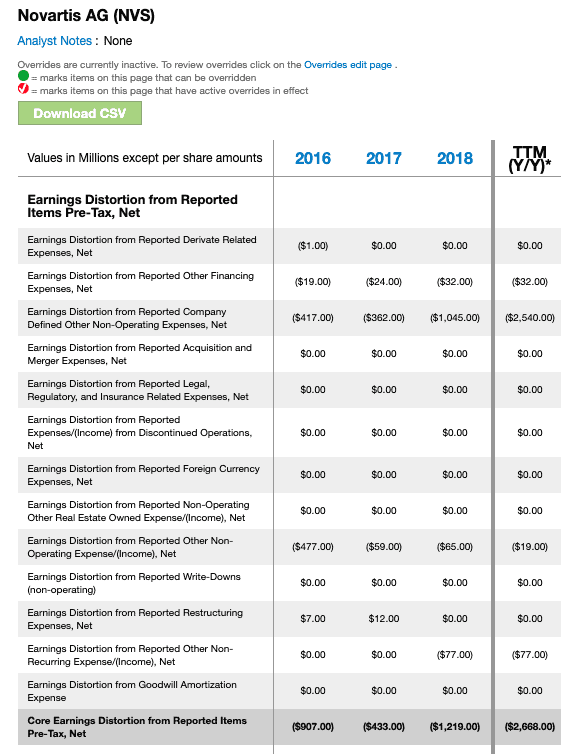
Sources: New Constructs, LLC and company filings
Clients who subscribe to our valuation models get access to all the data behind our calculations. Our models also provide audit-ability of all data back to the original 10-Ks and 10-Qs upon which our models are built.
Analyzing Core Earnings & Earnings Distortion for the Overall Market
We leverage our database of footnotes adjustments and calculation of core earnings to spot trends across the market. Core earnings, over the trailing twelve months (TTM) period through November 18, 2019, fell below GAAP net income for the first time since 2006. Investors only looking at reported earnings would get a misleading picture of profitability across the market. Over the TTM period through November 18, 2019, GAAP earnings fell 1% while core earnings fell 6%. More details are in our report on this topic.
Figure 5: GAAP Net Income vs. Adjusted Core Earnings: 2015-TTM (through November 18, 2019)
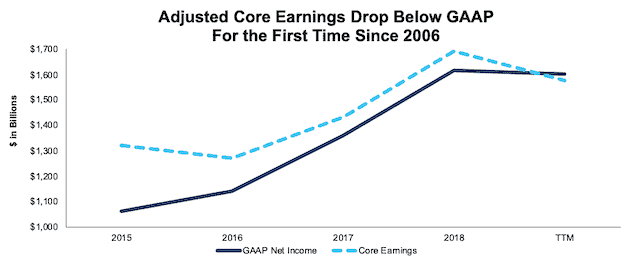
Sources: New Constructs, LLC and company filings.
This analysis is based on the top 1,000 companies by market cap in each measurement period.
Furthermore, earnings distortion from hidden gains is on a rapid rise, and core earnings have not been this overstated since 2000. Figure 6 shows the level of earnings distortion from the unusual gains and losses since 2000. Note the rapid rise in the distortion from gains buried in footnotes over the last few years.
Figure 6: Core Earnings Distortion: Worst Since 2000 – Data Through November 18, 2019
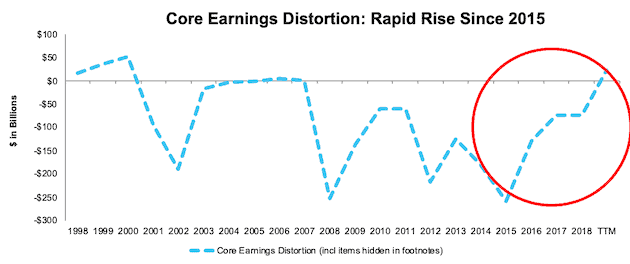
Sources: New Constructs, LLC and company filings.
Notably, earnings distortion is positive for the first time since 2007, and the highest it’s been since 2000. Soon after earnings distortion broke into positive territory, in 2006-07 and 1998-2000, the market crashed.
Most Under/Overstated GAAP Net Income Vs. Core Earnings
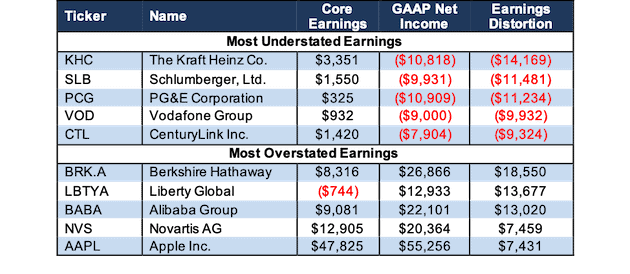
Figure 7 shows the companies with the most under/overstated TTM GAAP earnings as compared to core earnings as of January 8, 2020.
Figure 7: Companies with Most Understated/Overstated TTM Earnings as of January 8, 2020
Sources: New Constructs, LLC and company filings.
Per Figure 7, Berkshire Hathaway’s (BRK.A) core earnings are $18.6 billion less than its reported GAAP earnings over the TTM period. The large disconnect between reported earnings and core earnings stems from over $27 billion in gains from reported other non-operating income. These non-operating items include $10.5 billion, $9.8 billion, and $19.4 billion in unrealized investment gains on securities in 3Q19, 2Q19, and 1Q19 respectively.
This income is a direct result of Accounting Standards Update 2016-01, which changed the way companies account for changes in the fair value of securities. When discussing this accounting rule change in his 2017 letter to BRK.A shareholders, Warren Buffett noted “for analytical purposes…Berkshire’s bottom-line will be useless.” You can see how we handle this accounting rule change, and its impact on our models, here.
Liberty Global (LBTYA), Alibaba Group (BABA), Novartis AG (NVS), and Apple Inc. (AAPL) also have significantly overstated GAAP net income after adjusting for earnings distortion.
On the other hand, Kraft Heinz’s (KHC) net income greatly understates its core earnings. Kraft Heinz (KHC) famously took a $16 billion write-down when it filed its 2018 10-K. When combined with other non-core expenses, such as $598 million in goodwill and intangible asset impairment losses in 2Q19, we see that KHC’s core earnings of $3.4 billion are much higher than its -$10.8 billion reported GAAP net income.
Schlumberger, Ltd. (SLB), PG&E Corporation (PCG), Vodafone Group (VOD), and CenturyLink Inc. (CTL) each reported GAAP net income that understated the core earnings of their business operations in the TTM period. However, understated earnings alone don’t mean a stock is worthy of investment. All five stocks with the most understated earnings in Figure 7 receive a Neutral-or-worse rating.
Get Earnings Distortion Scores for All ~3000 Stocks Under Coverage
We leverage our earnings distortion measure to provide Earnings Distortion Scores for all stocks under coverage. These scores indicate how likely companies are to beat or miss expectations.
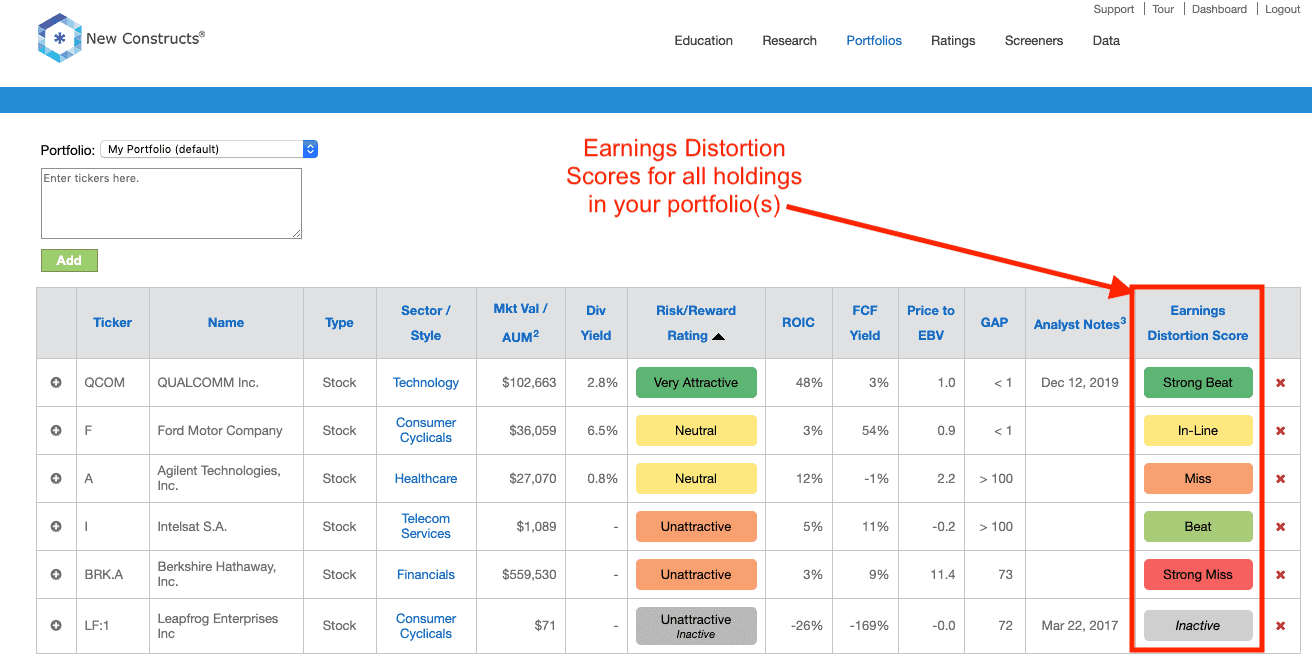
All members get our Earnings Distortion Scores for the stocks in their portfolios. Per Figure 8, you’ll see the Earnings Distortion Score at the far right of your Portfolios.
Figure 8: Earnings Distortion Scores on the Portfolios Page
Sources: New Constructs, LLC and company filings
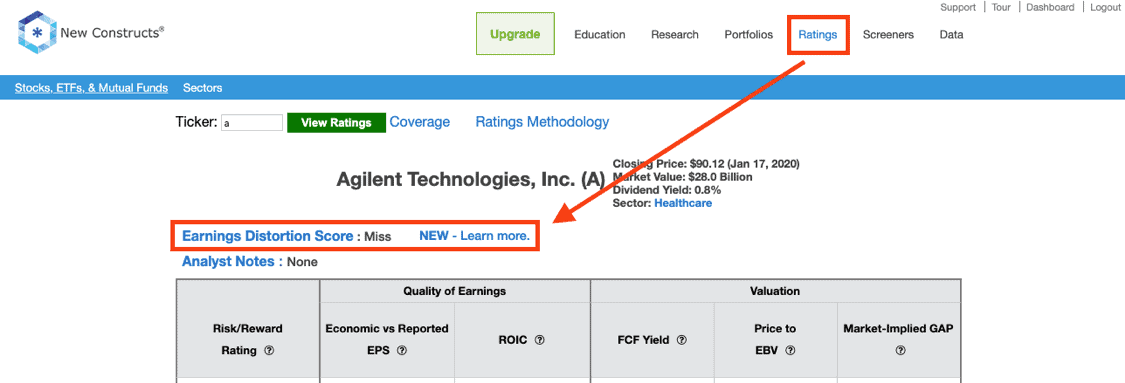
Platinum and higher members also get our Earnings Distortion Scores on the Ratings page. Per Figure 9, the Earnings Distortion Score will display above Analyst Notes on the Ratings page.
Figure 9: Earnings Distortion Scores on the Ratings Page
Sources: New Constructs, LLC and company filings
This article originally published on January 13, 2020.
Disclosure: David Trainer, Kyle Guske II, and Sam McBride receive no compensation to write about any specific stock, style, or theme.
Follow us on Twitter, Facebook, LinkedIn, and StockTwits for real-time alerts on all our research.
Click here to download a PDF of this report.
The post Core Earnings & Earnings Distortion: Explanation & Examples appeared first on New Constructs.